DIY Color Calibration Chart: From Sublimation Printer to Acrylic Paint
The plan from the CR30 teardown: print a set of known color patches, measure each with the CR30, and use ArgyllCMS to build a correction profile. Simple in theory. In practice it took two completely different approaches before I got anything usable.
What ArgyllCMS expects
ArgyllCMS can generate a target chart — a grid of color patches with known Lab values — and then, after you measure each patch with a colorimeter, compute the delta between what you printed and what you intended. From that it builds an ICC profile or a Darktable color checker correction.
The generated chart is just a TIFF with an accompanying .cht descriptor file. You print it, measure it, done. Except "print it accurately" turned out to be the hard part.
Attempt 1: Sublimation printer
I have an old sublimation printer. CMY only — no black, no extended gamut. The prints look decent to the eye, but CMY-only puts a hard ceiling on how accurately you can hit saturated reds and deep blues.
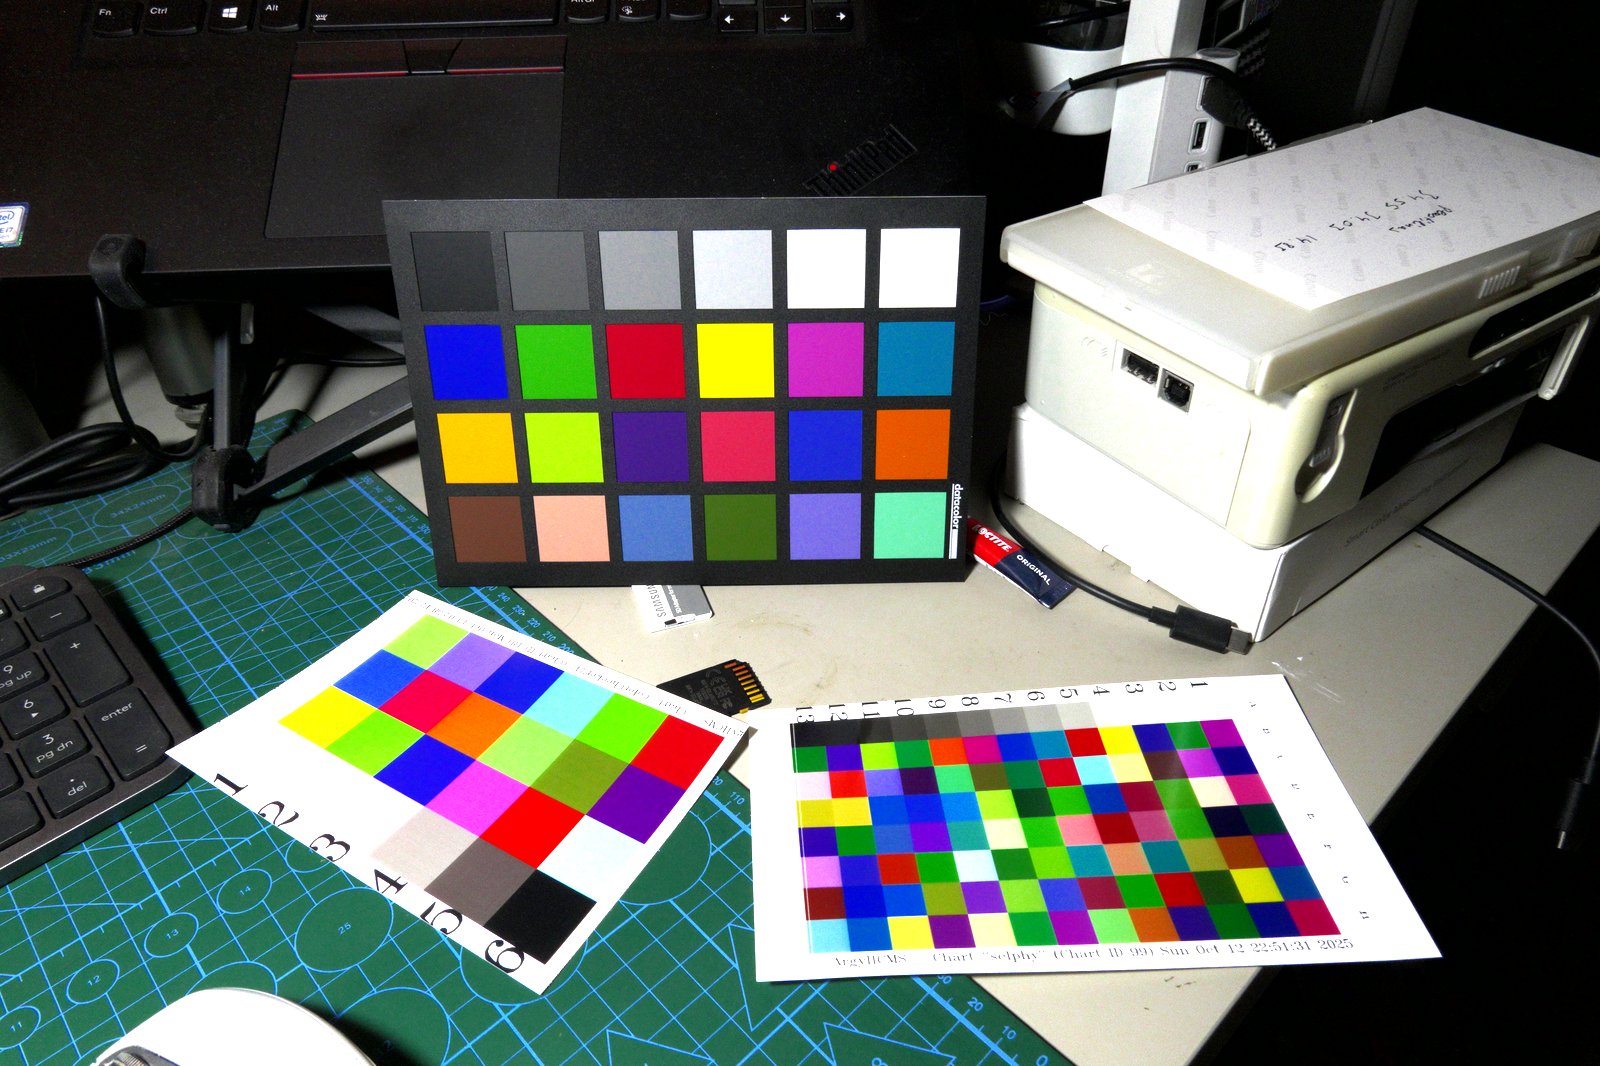
The left chart is a ColorChecker24-sized target generated with ArgyllCMS. The right one is a denser 96-patch target — also ArgyllCMS, different randomized layout. The real SpyderChecker 24 sits in the back for comparison.
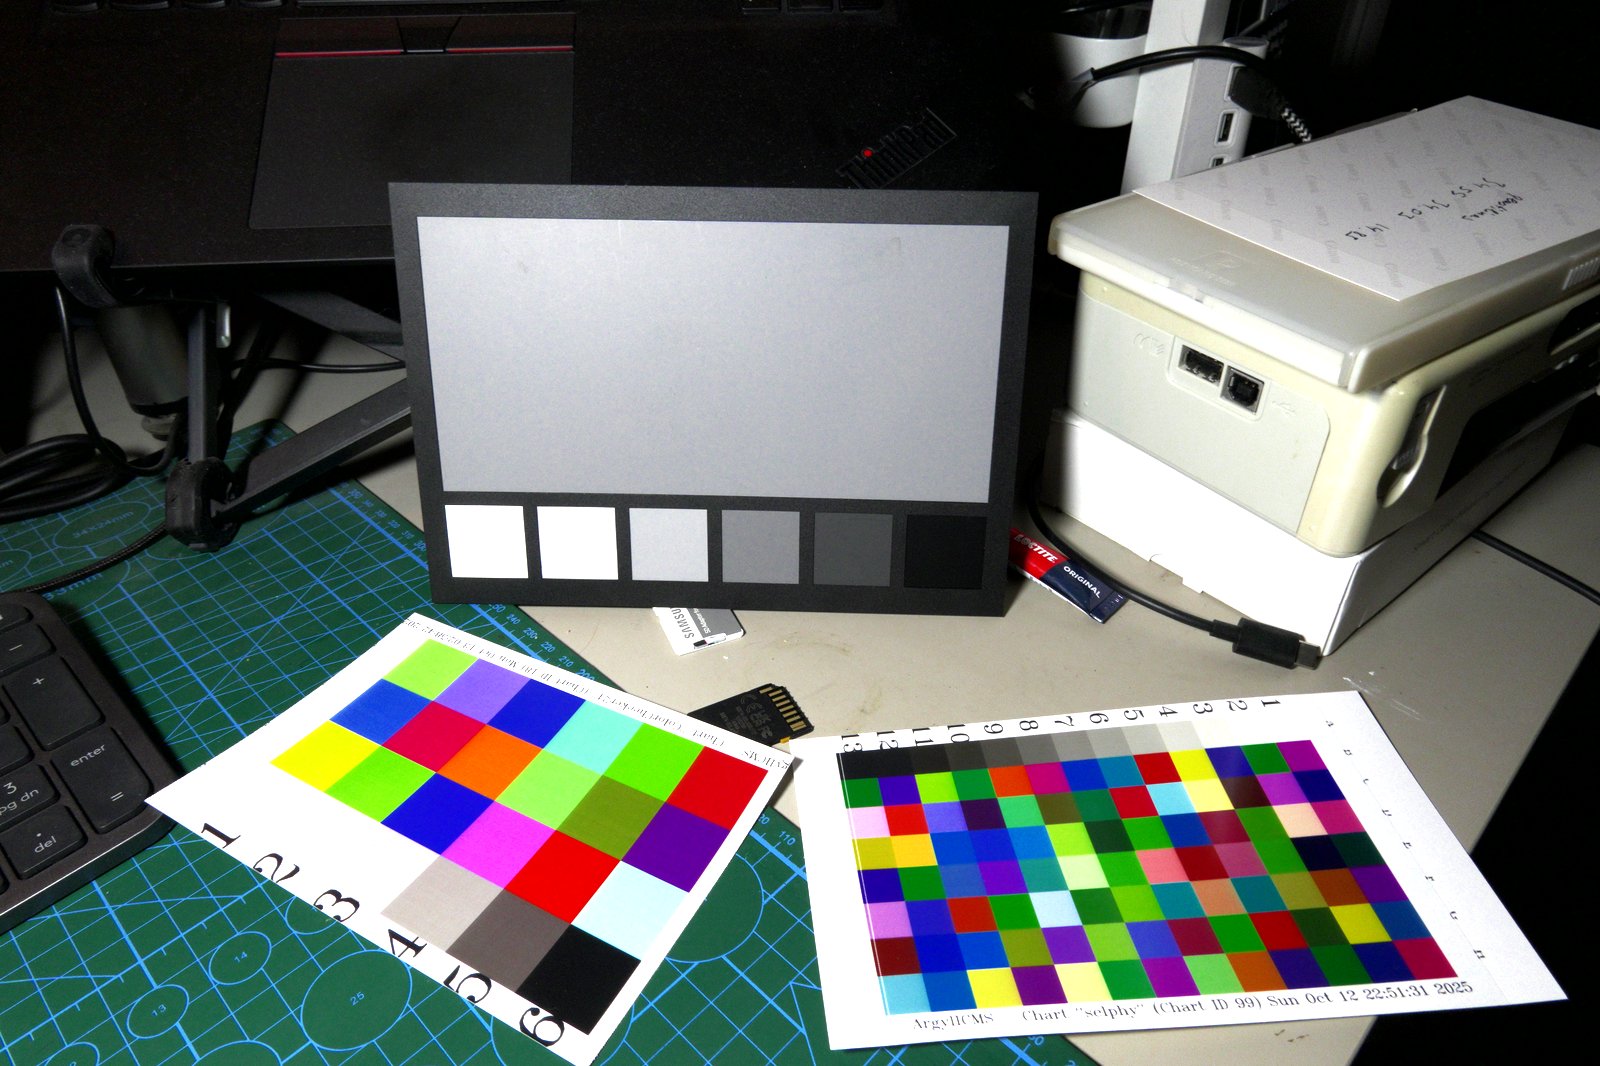
The sublimation prints aren't terrible. For Darktable's built-in color calibration the 24-patch chart is actually fine. But measuring the printed patches with the CR30 revealed the issue: the CMY gamut clips hard in certain reds and yellows. The ΔE on those patches is large enough to make the resulting profile unreliable for anything serious.
Good enough for a rough correction, not good enough to validate the CR30 software's accuracy.
Attempt 2: Acrylic paint
If the printer can't hit the colors accurately, paint them by hand. Acrylic paint gives you access to real primaries — including colors a CMY printer can't reproduce — and the CR30 can measure each patch directly on the painted surface.
The substrate: small squares cut from a rigid white plastic sheet, painted individually so each patch can be remeasured and recoated without redoing the whole chart.
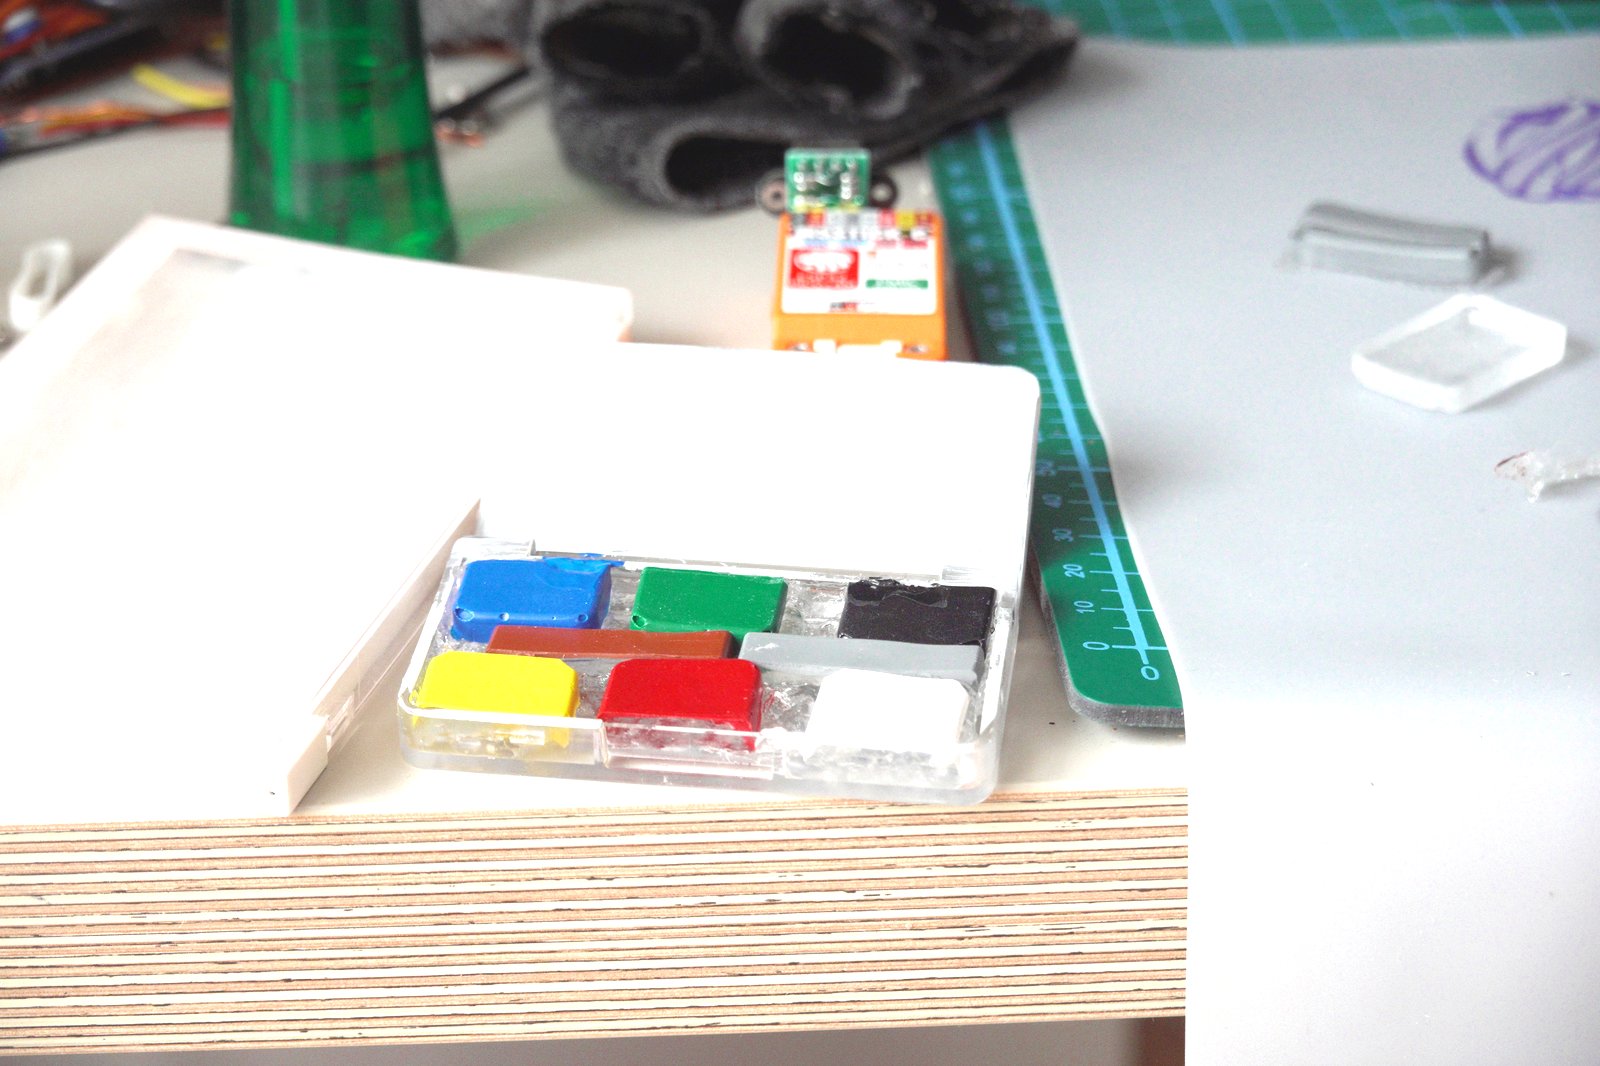
Primary colors: blue, green, black, yellow, red, gray, white. The chips in the tray are the dried swatches cut from the plastic sheet.
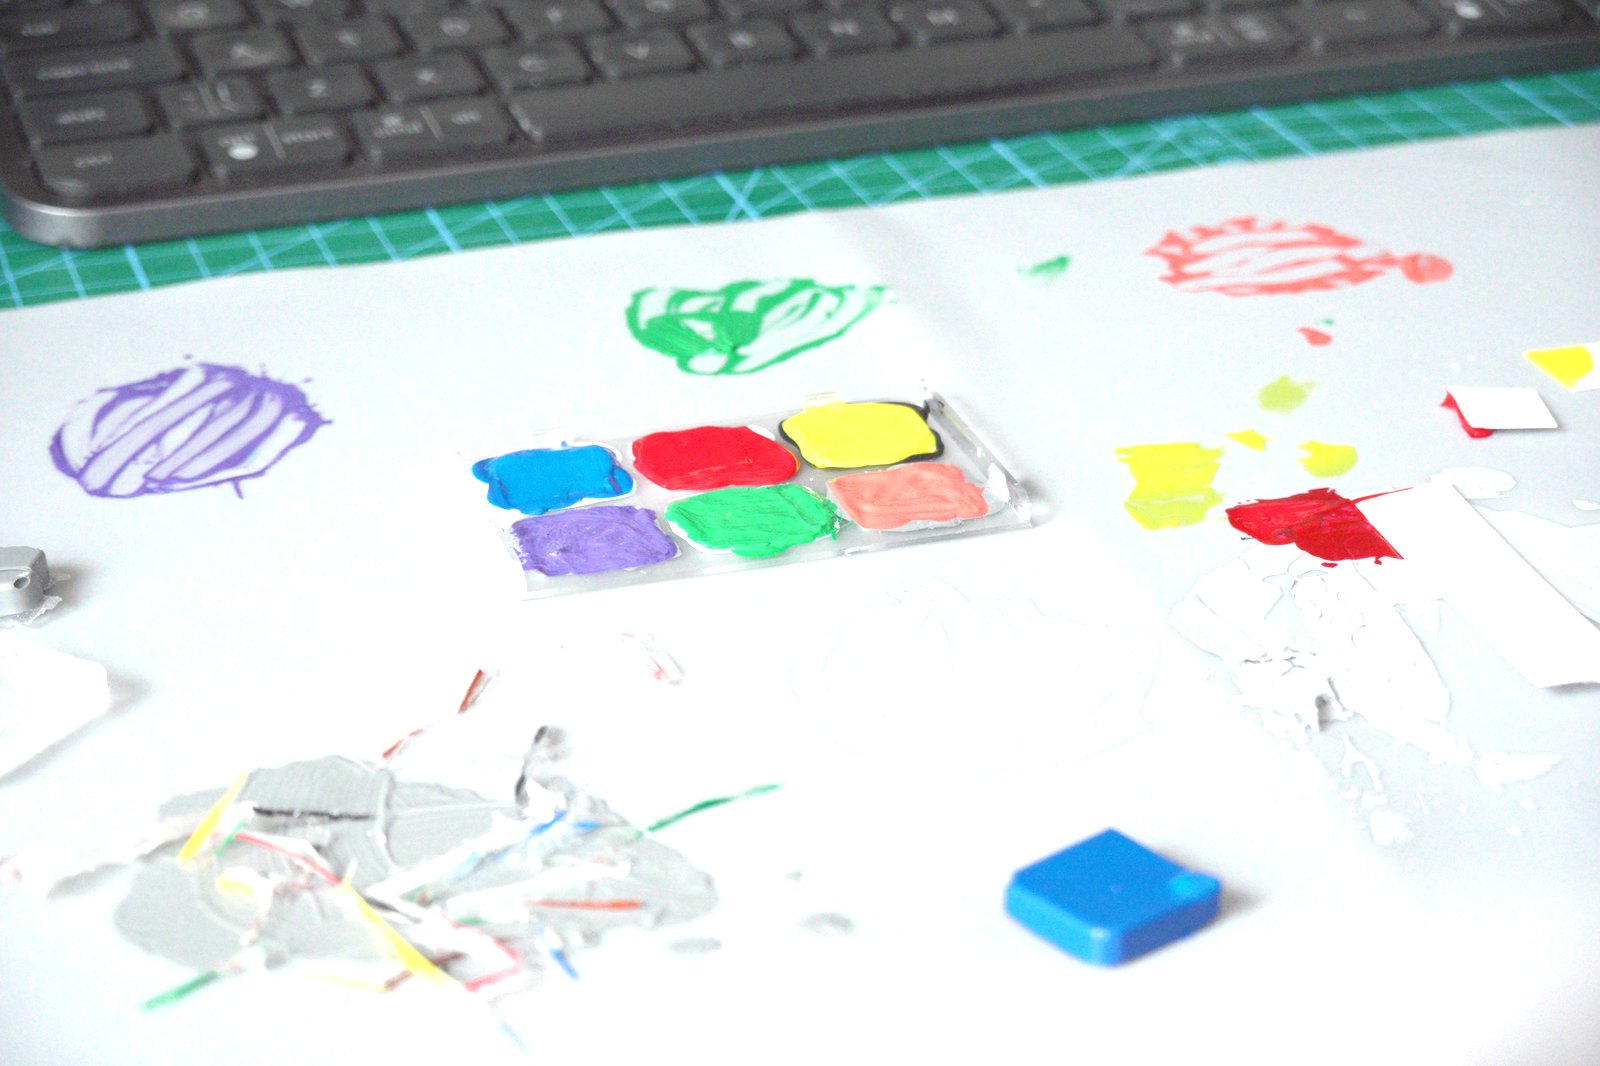
Mixing in progress. The top half of the tray holds the base primaries; the bottom half is where I mixed secondaries and adjusted lightness with white.
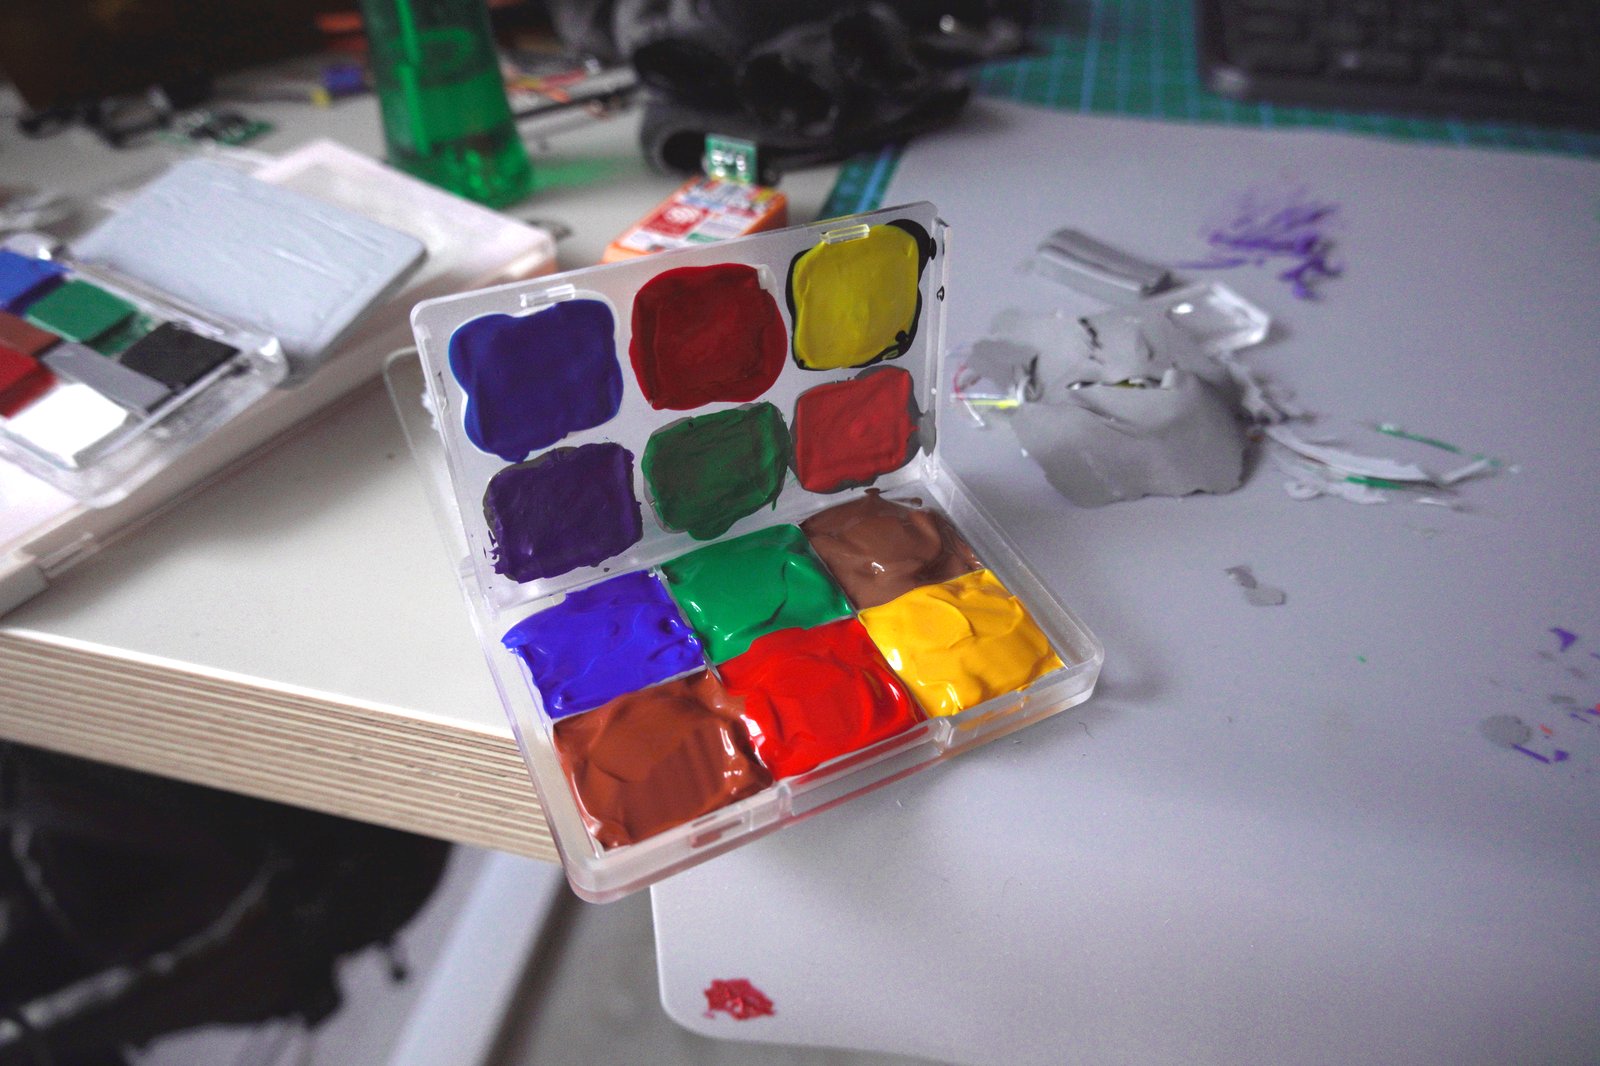
The acrylic approach opened up a whole different problem: batch-to-batch consistency. Acrylic paint dries slightly darker than it looks wet, and thin coats transmit the white substrate, shifting the measured color toward white. Two coats minimum, ideally three, with the CR30 measuring after each coat to confirm the color stabilized.
The upside: the measured colors are genuinely where they need to be. Mixing ultramarine blue gives you a real blue — not the printer's nearest approximation. Same for yellow, red, and the neutrals.
Why this matters for Darktable
Darktable's color calibration module works by taking a shot of a known color reference under the same light as your subject, then computing a 3×3 matrix (plus offsets) that maps the camera's raw response to the reference Lab values. Normally you'd buy a ColorChecker or SpyderChecker. These DIY charts are a cheaper alternative — provided the reference values you feed Darktable actually match what's on the physical chart.
That's exactly what the CR30 provides: measured Lab values for each patch under D65 illuminant. Feed those into ArgyllCMS alongside the photo measurements and you get a correction that's grounded in actual measurement rather than a factory spec sheet.
Whether the DIY chart is accurate enough is still an open question — and currently unanswerable, because I never systematically labeled the patches. I measured them, but without a labeling system I can't now tell you which physical patch corresponds to which measurement. The plan was to label each one, then run a monthly aging test: acrylic does shift over time, and knowing the rate of hue drift would tell you when a patch needs recoating. The aging test requires someone who sticks to a schedule. I don't, so it hasn't happened.
The calibrator problem
Most consumer monitor calibrators — Datacolor Spyder X, X-Rite ColorMunki Display — measure only RGB (or a few broad bands). They give you a corrected gamma curve and white point, which is fine for display calibration, but they don't give you the actual spectral power distribution of your monitor's primaries. For serious color work — understanding why a monitor's gamut is shaped the way it is, or validating that a display can actually reproduce the colors in your calibration workflow — you want spectral data.
The CR30 measures reflected spectrum only — emissive displays are outside its scope entirely. The screen spectra below were captured with the DIY visible spectrometer I built separately. The blue and green channels are roughly what you'd expect from a typical IPS panel. The red channel is more interesting.
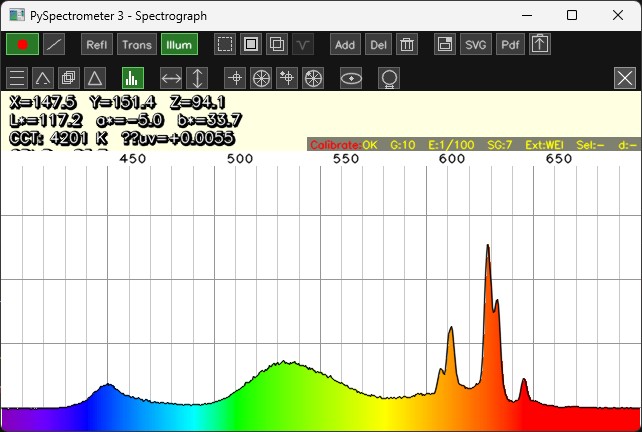
The double spike is what matters for colorimetry: that secondary at 600 nm means the display's red carries a significant orange component. To the eye it doesn't matter — the visual system integrates across the channel either way. For calibration work it's a systematic error that a 3×3 matrix correction can only partially compensate.
For proper monitor characterization I'd need a spectrophotometer with an emissive mode — i1Display Pro Plus, or ideally an i1Pro 3. The CR10 colorimeter I have is another candidate: it runs on an ESP32 internally, which should make the firmware hackable to add emission measurement, though I haven't gotten there yet. The price gap between a basic colorimeter and a real spectrophotometer is significant regardless, and I haven't pulled the trigger on either.
Which brings me to the other part of the problem: even if I had the perfect calibrator and the perfect DIY chart, my current monitor probably isn't the right tool for photo and video work. That's a separate purchase decision, and one I'm trying not to make until I understand exactly what the spectral limitations of my current display actually are.
Where this leaves things
The acrylic chart is built. Whether it's accurate enough is still unknown — that depends on labeling the patches properly and validating them against the SpyderChecker 24's known Lab values, which hasn't happened yet. The aging test hasn't happened either. What's left is more foundational than it looked when I started: photograph both charts under controlled light, run them through ArgyllCMS, and see how the corrections compare once the reference values are trustworthy.
The harder question turned out to be the monitor. The chart may already be more accurate than the display it's meant to calibrate — and the instrument needed to properly characterize that display costs more than the display itself. The sublimation prints are still useful as a quick baseline. The acrylic chart is waiting for a calibrator worth trusting on the other end.