DIY Diffraction Grating Spectrometer, Not a Prism
Still trying to solve the monitor calibration problem — need to measure the actual spectral output of my monitor's primaries, not just RGB. The CR30 held against the screen gives something, but it's not designed for emissive sources. What I need is the pocket jewel spectroscope I've been using all along, properly integrated with the OV9281 camera module.
I pulled it apart to design a better 3D-printed holder. And in the process found out I've been wrong about it for as long as I've owned it.
It's not a prism
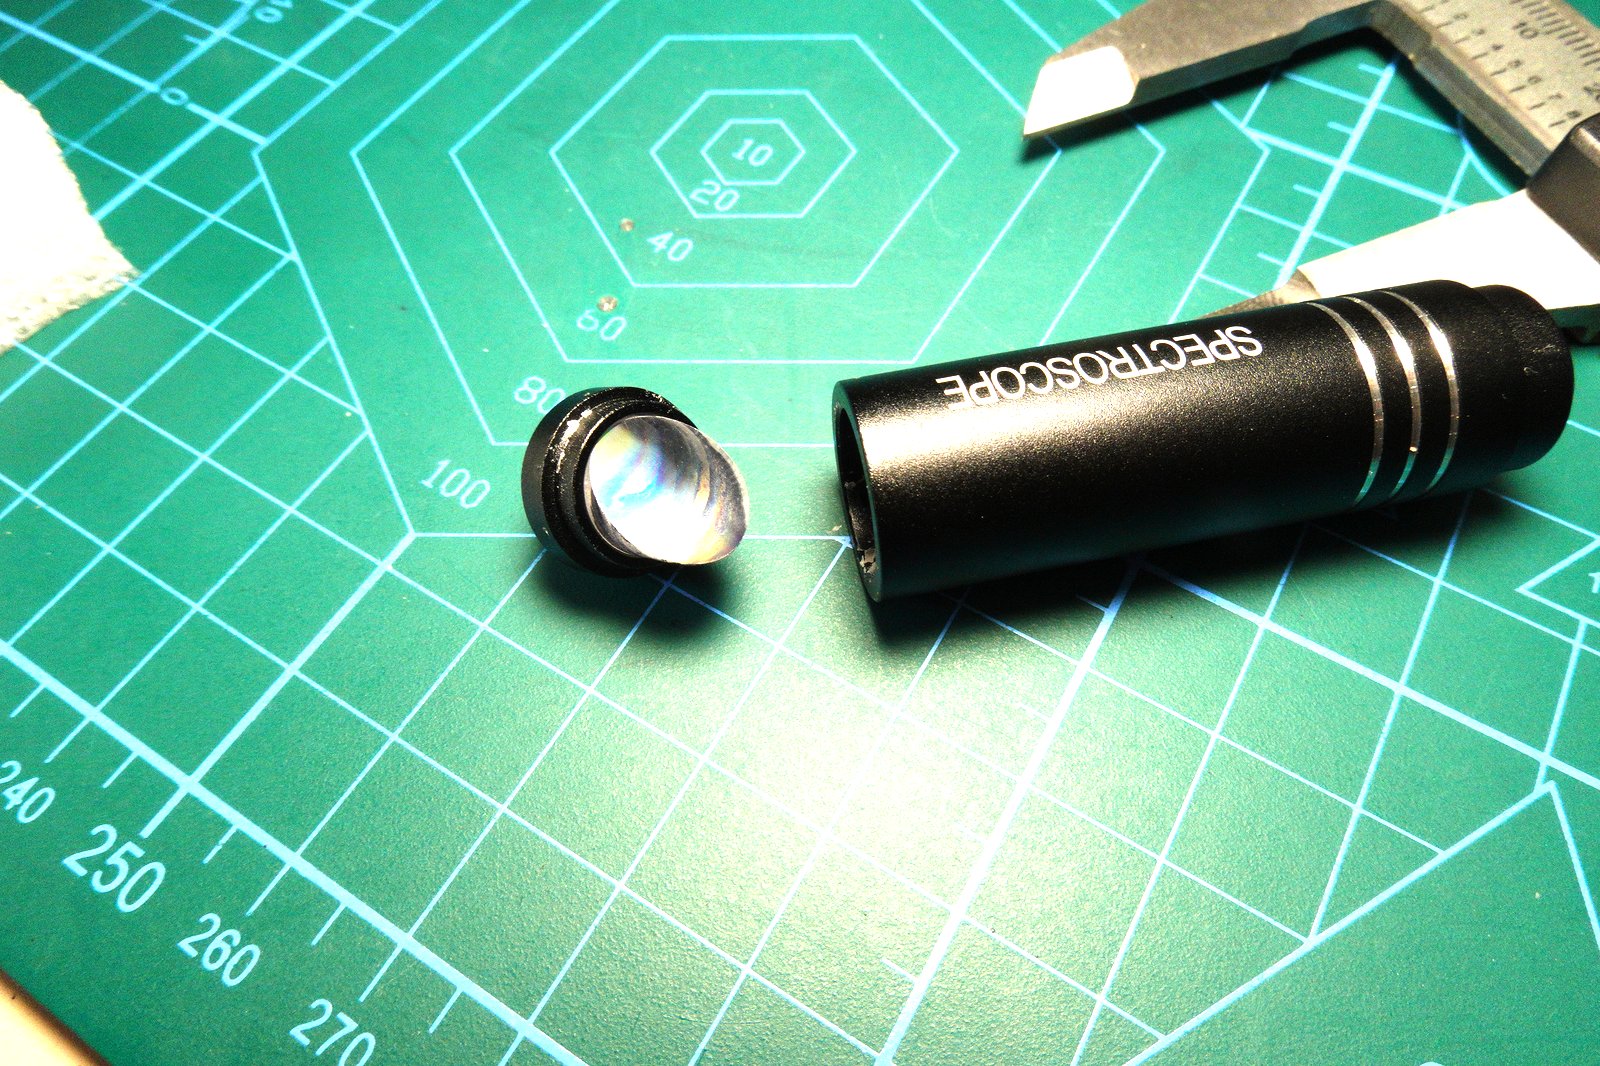
The front unscrews and the lens element comes right out. Inside: a slit, a diffraction grating, and an eyepiece. Not a prism. A grating.
I've been calling this a "jeweler's prism spectrometer" since I bought it. The device is labeled "SPECTROSCOPE" and sold alongside gem testing tools. Traditional jeweler's spectroscopes do use prisms. This one doesn't. Somewhere along the way I assumed, never verified, and built that assumption into everything I've written about it since.
This is the same instrument I've been using with the OV9281 camera and Raspberry Pi Zero for all my spectral measurements. The spectroscope body, the alignment, the calibration — all of it was done under the assumption that the dispersive element followed Cauchy dispersion, like a prism. It doesn't. It follows the grating equation.
Why the data already knew
Looking back at the calibration curves, this actually explains something that had been nagging me: they were suspiciously linear.
With a glass prism, you'd expect non-linear wavelength dispersion — shorter wavelengths (violet, blue) compressed together, longer wavelengths (red) spread out. The relationship follows the Cauchy equation for the glass's refractive index. You calibrate it with a polynomial fit and end up with a noticeably curved mapping from pixel position to wavelength.
My calibrations kept coming out nearly linear. Pixel 100 is roughly as far from pixel 200 as pixel 200 is from pixel 300, in wavelength terms. I attributed it to the specific prism geometry and moved on. It's not the prism geometry. It's because gratings produce linear dispersion — wavelength is proportional to diffraction angle, and at the small angles in a compact instrument, that maps nearly linearly onto a flat sensor.
The data was telling me the whole time. I wasn't listening.
What else the grating explains
The 800nm wall
I could never get clean data past about 800nm. Past that point the signal turns into noise and internal reflections — I assumed it was a mechanical alignment issue with the holder, or maybe the camera sensitivity dropping off.
It's neither. It's a fundamental property of gratings: diffraction orders overlap.
The grating equation d sin(θ) = mλ means every wavelength diffracts at every integer order m. The 2nd-order diffraction of 400nm light lands at exactly the same angle as the 1st-order diffraction of 800nm. So above ~800nm, the sensor simultaneously receives 1st-order 800nm and 2nd-order 400nm from the same grating position. The spectrum is contaminated — you can't separate them without an order-sorting filter.
The irony: in the portable spectrometer article I wrote at length about gratings distributing light across multiple diffraction orders as a disadvantage versus prisms. I was right. I was describing my own instrument's problem. I just didn't know it.
A prism has no orders. All the light goes into one continuous spectrum with no overlap. If I actually had a prism, this wouldn't be an issue.
The fix is an order-sorting longpass filter — a piece of glass that blocks wavelengths below ~400nm when measuring above 800nm, preventing 2nd-order UV from polluting 1st-order NIR. For now the practical upper limit is ~780nm, which covers the full visible range and is sufficient for color science and monitor characterization.
The IR filter
While trying to calibrate spectral sensitivity against a black body source (an incandescent lamp — CIE Illuminant A, ~2856K tungsten), I expected the measured spectrum to rise toward IR as per the Planck curve. It doesn't. It cuts off sharply.
There's an IR cut filter somewhere in the optical path — either in the OV9281 module or inside the spectroscope itself. The Planck curve for a tungsten lamp rises steeply into NIR; a clean measurement should track that. Instead: cliff edge around 700–720nm, then nothing.
This makes the instrument visible-only in practice. Fine for color science — the visible range is what matters. But it changes the sensitivity calibration: the black body reference only works for the visible portion of the spectrum. The correction curve has an unconstrained tail in NIR that either has to be handled carefully or simply cropped.
Between the 800nm order-overlap problem and the IR filter, "NIR spectroscopy" is off the table with this instrument in its current form. Visible-only it is.
Finding the alignment angle
Gratings and prisms also differ in how they're positioned relative to the camera. With a prism you have flexibility — you can tilt and rotate and find the spectrum from a range of camera positions. With a grating, the first-order diffracted spectrum sits at a specific angle off the incident light axis, determined by the grating equation:
1d sin(θ) = mλ
For a fixed grating frequency d, the diffraction angle θ varies with wavelength — that's how the spectrum is spread. But the center of the visible spectrum lands at a fixed angle, and the camera has to be placed there.
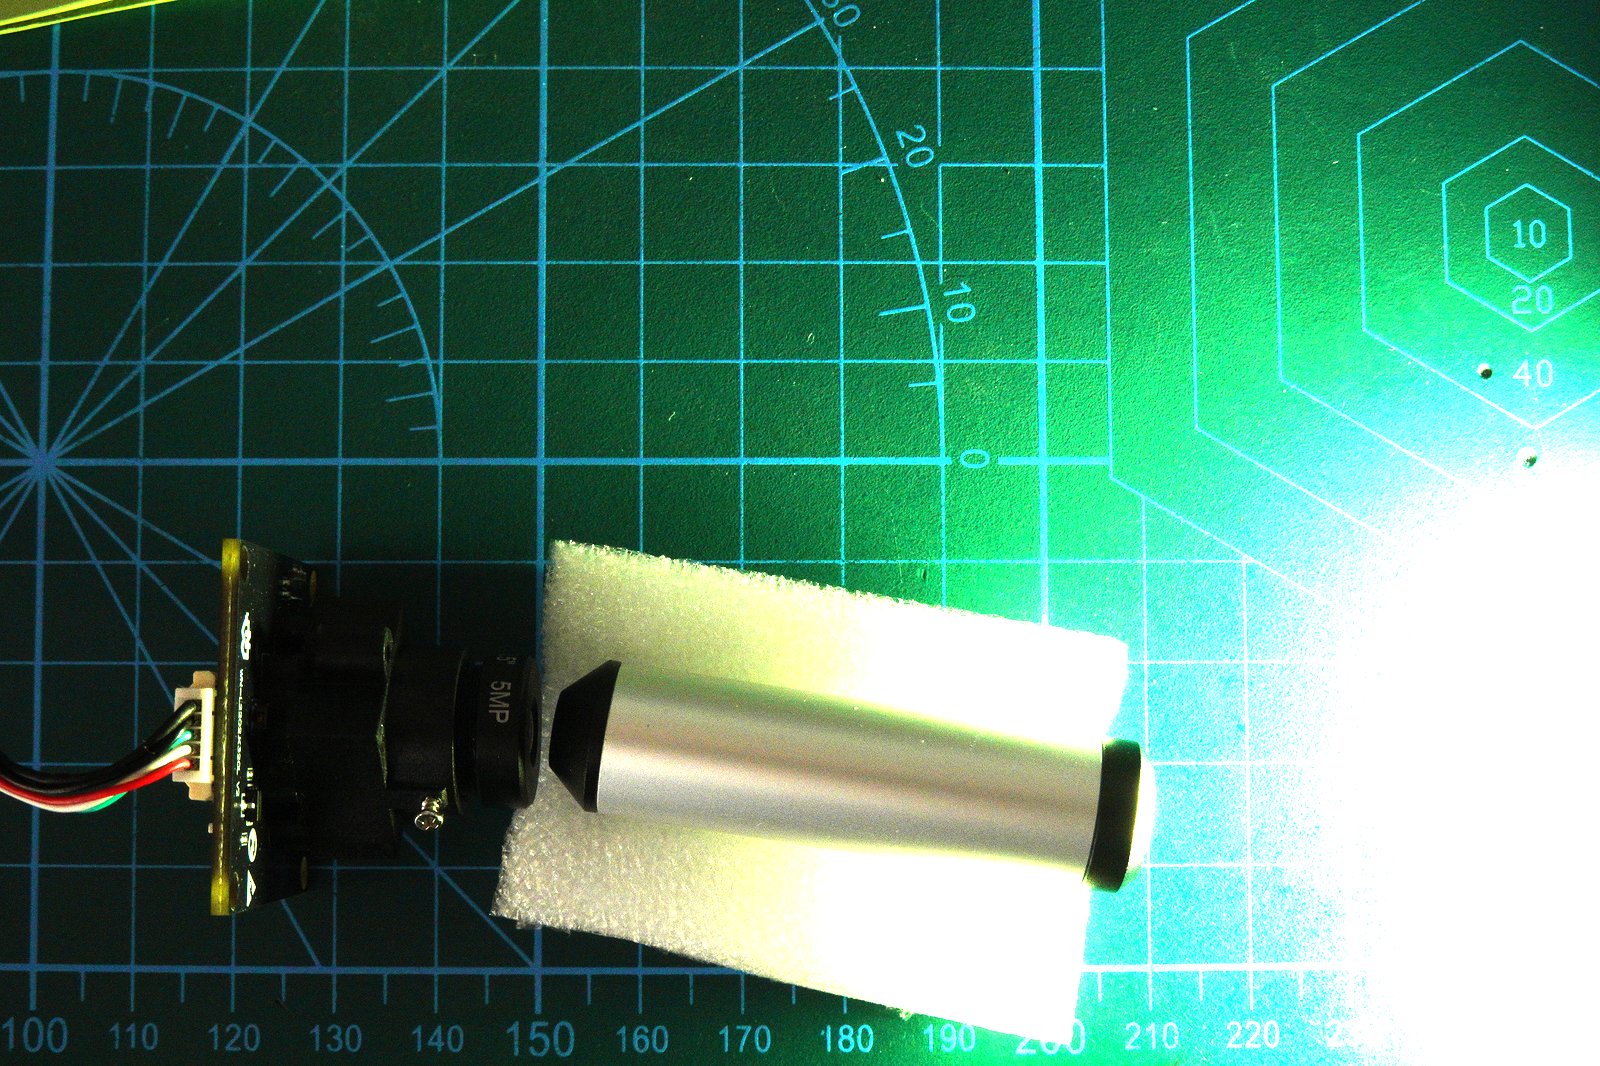
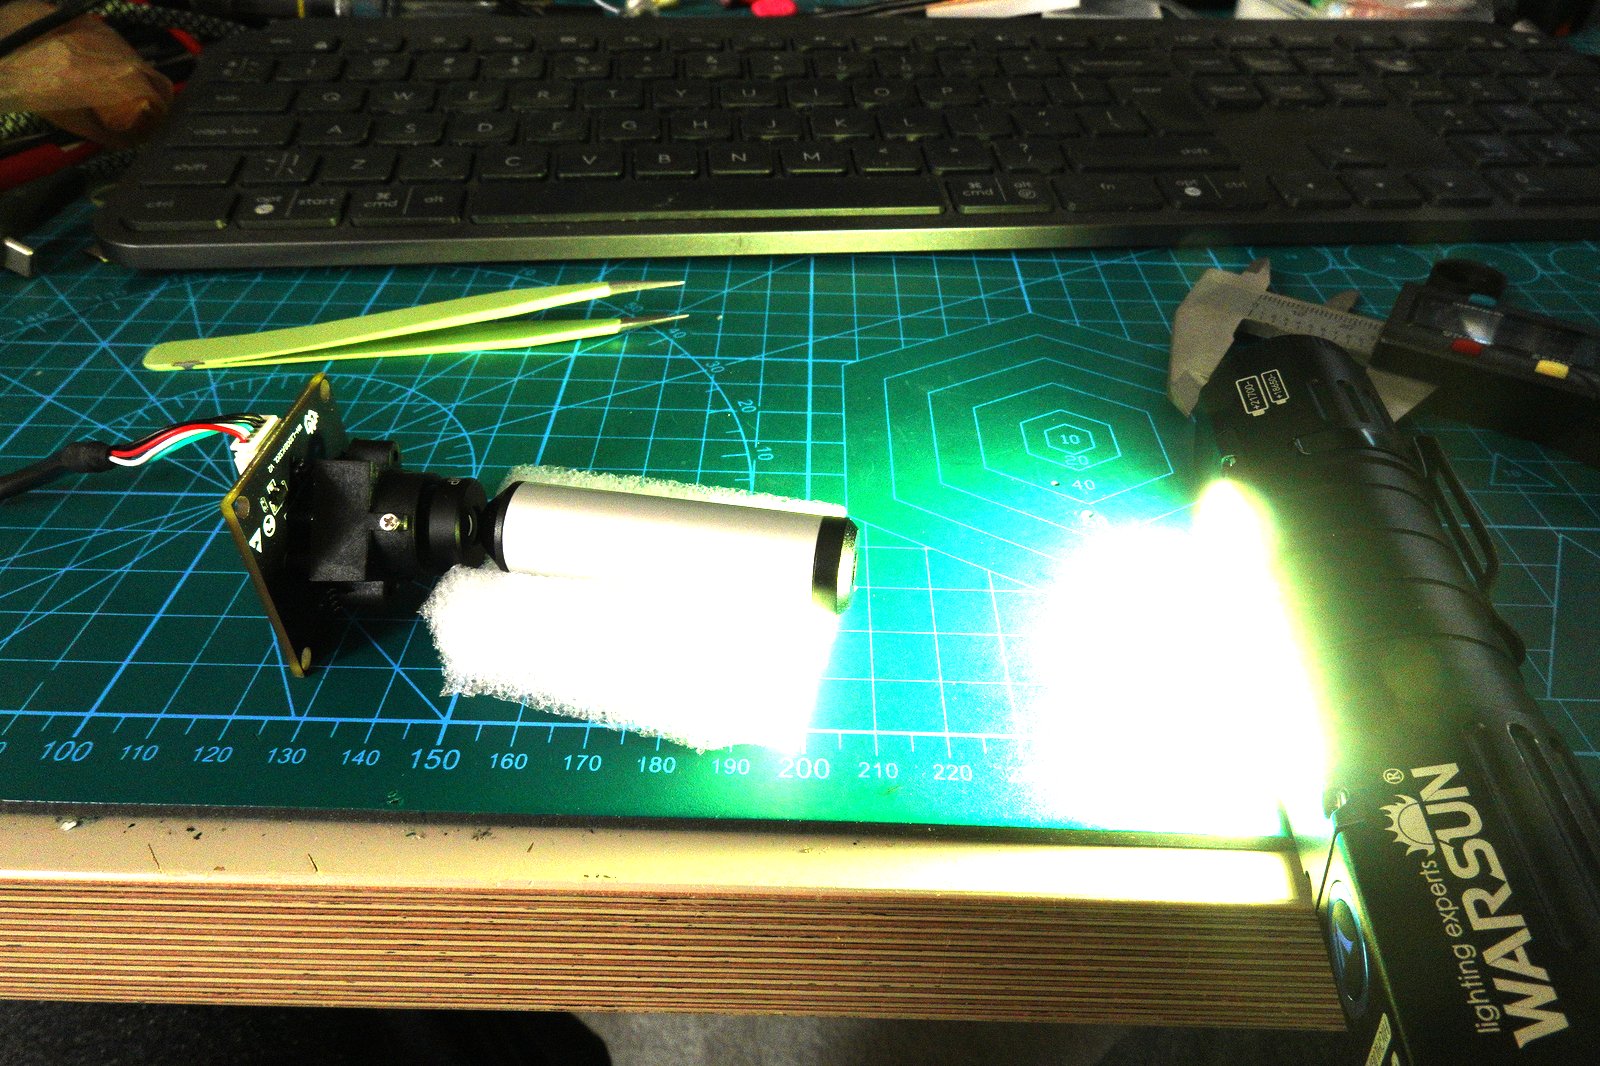
Method: mount the OV9281 module and spectroscope on the cutting mat, shine a Warsun flashlight into the slit, and physically rotate the camera while watching the live view until the spectrum is centered and in focus. The angle markings on the cutting mat give a direct readout.
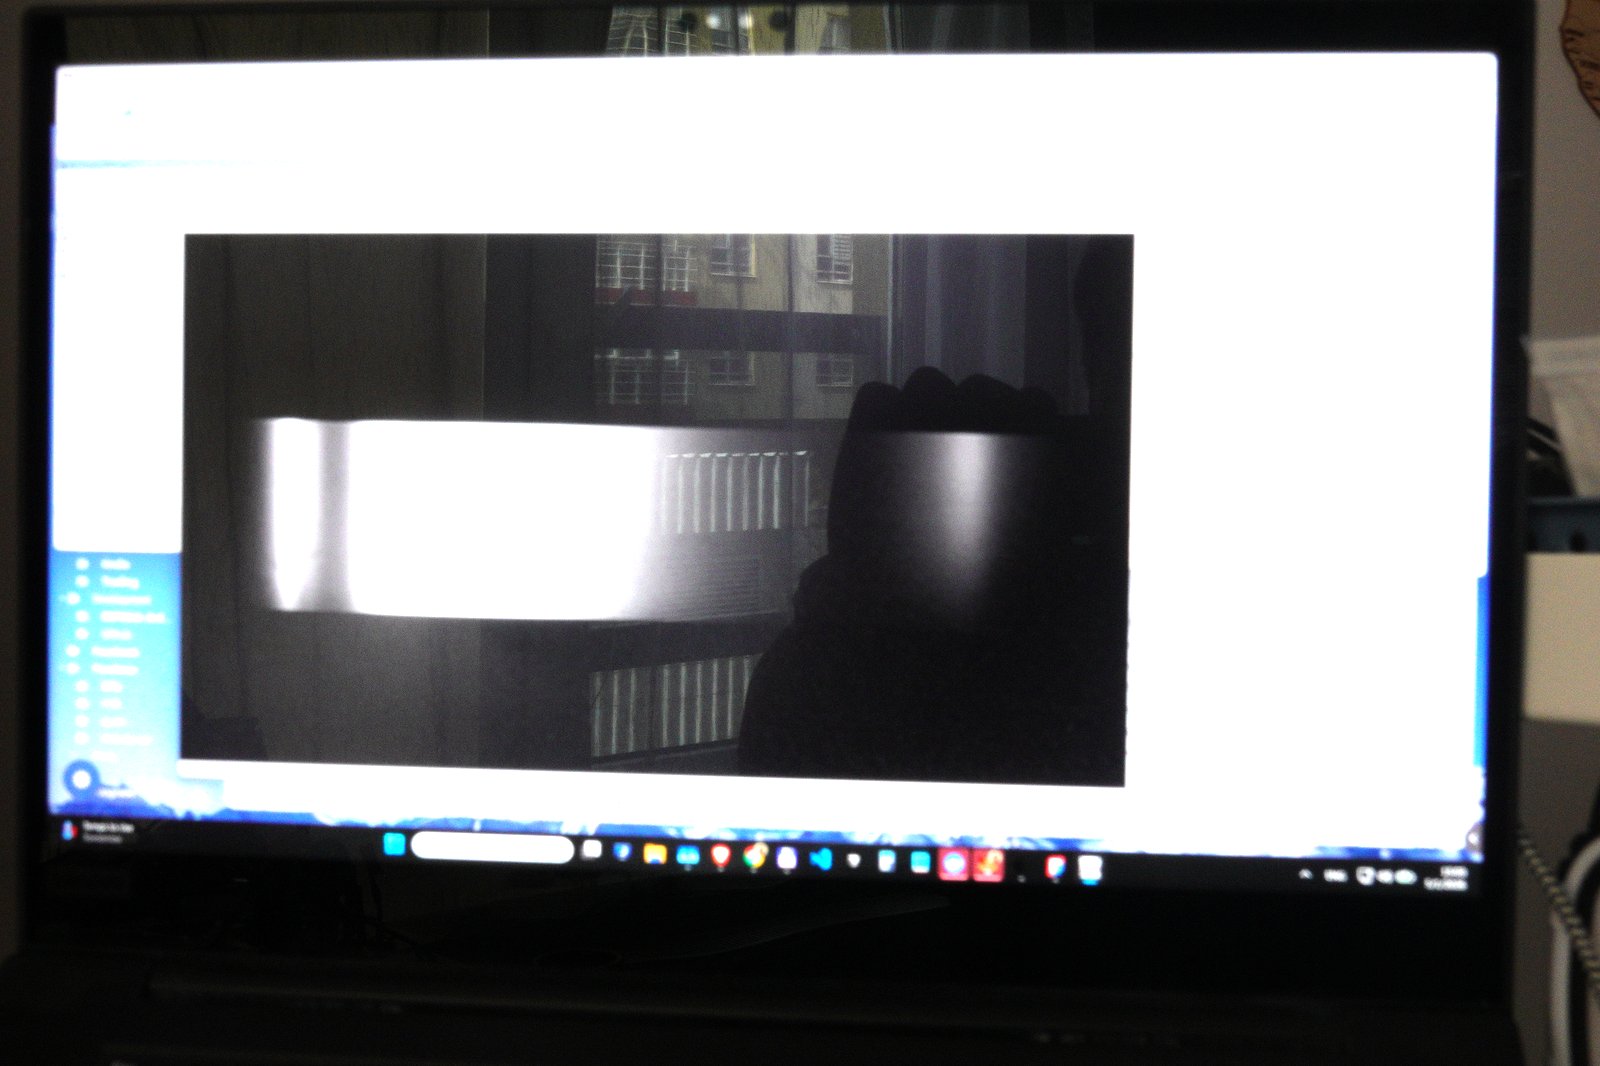
This is what the camera sees: the grating ruling visible as vertical lines, with the dispersed spectrum as a horizontal bright band across the center of the frame. Rotate until that band is horizontal and fills as much of the frame width as possible — then read the angle.
Measured alignment: approximately 20–22° off the optical axis of the spectroscope barrel. That's the angle that goes into the 3D model.
What goes into the holder
- Angle: ~21° between spectroscope barrel axis and camera mount axis
- Working distance: set by the OV9281 lens focal length and the spectroscope's exit pupil — currently measuring to confirm
- Rigidity: no flex; even a degree of camera wobble shifts the spectral band off-center
The existing holder was designed around the assumption of a near-coaxial prism geometry. It needs to be redesigned from scratch for the correct grating angle.
The software also grew
While figuring all this out I've also been rewriting the spectrometer software — what started as a quick fork of PySpectrometer2 by Les Wright has turned into something considerably larger. The new version lives at github.com/foxis/PySpectrometer3 (ended up in the wrong account — should be itohio, will fix).
Features that weren't in the original plan: Raman shift mode, Color Science mode with XYZ/LAB/CRI/CCT output, pluggable camera backends (Picamera2, OpenCV, RTSP, HTTP MJPEG), sensitivity correction against reference illuminants, PDF reports, auto-rotation detection for the grating tilt angle. That last one is directly relevant here — the software can auto-detect the spectrum rotation and correct for it, which partly compensated for the fact that the holder was never quite at the right angle.
More on the software in the next post.