ELRS Telemetry Ratio and EdgeTX Log Rate (Part 6)
EdgeTX Cockpit Voice, part 6 of 9. Making a RadioMaster GX12 speak its own telemetry, so a low battery is something I hear instead of something I forgot to look at.
‹ Part 5: Where the Callouts Come From · Part 7: Two Antennas, Two Bands › · Start at part 1
The red button in this setup writes a CSV to the SD card. That log turns out to be the most interesting object in the whole project, and also the one I understood worst.
Telemetry logging, and the number you have to measure yourself
The red button drives LOGS with def: "3,1", a 0.3 second log period,
writing a CSV to the SD card. This is where I have to stop making claims and
start pointing at homework, because the honest answer is that I have not
measured the thing that matters.
Log fidelity is not set by the log period. It is bounded by three things in series, and the log period is only the last one:
- The ELRS telemetry ratio, how often the RF link gives the downlink a slot at all.
- CRSF frame round-robin, the FC has several different frame types to send, and each telemetry opportunity carries one.
- The EdgeTX log period, how often the radio samples whatever value it most recently received.
My own sensor list makes point 2 concrete. Grouping my sensors by their CRSF frame ID:
| CRSF ID | Frame type | Sensors it carries |
|---|---|---|
0x02 | GPS | GPS, GSpd, Hdg, GAlt, Sats |
0x08 | BATTERY_SENSOR | RxBt, Curr, Capa, Bat% |
0x1E | ATTITUDE | Ptch, Roll, Yaw |
0x21 | FLIGHT_MODE | FM |
0x14 | LINK_STATISTICS | 1RSS, 2RSS, RQly, RSNR, ANT, RFMD, TPWR, TRSS, TQly, TSNR |
Note that Sats and GAlt arrive together, in the same frame, they can
never be out of sync with each other. But RxBt lives in a different frame
entirely, so it updates independently, and slower than the raw telemetry slot
rate.
The naive arithmetic: at a 500 Hz packet rate with a 1:4 telemetry ratio you get
125 downlink slots per second, and with four flight-data frame types
round-robining, RxBt would refresh about 31 times a second. Against that, a
0.3 s log period is massively undersampling. I would be logging one sample in
ten and would miss every sag transient.
Do not believe that number. It is arithmetic from the frame structure, not a measurement, and it ignores that ELRS telemetry slots carry a small payload while a CRSF GPS frame is comparatively large, so one frame gets fragmented across several slots.
So I measured it instead, and the measurement was already sitting on the SD card. The log period is 0.3 s. If a sensor genuinely arrives faster than that, every row holds a fresh value. If it arrives slower, the CSV contains runs of identical consecutive values, and the mean run length is the ratio between the true arrival interval and the log period. Count the runs per column and you have the answer, with no assumptions in it.
On a 3-inch build, one ten-minute flight, this is what came out:
| Tier | Sensors | Measured interval | Rate |
|---|---|---|---|
| FC flight data, over the air | Ptch Roll Yaw RxBt Curr Capa | 3.6 to 3.9 s | ~0.26 Hz |
| Radio-local link stats | TRSS TSNR 1RSS RQly | 0.30 s, every log row | >= 3.33 Hz |
The quantum is clean rather than fuzzy. Of 110 runs of identical Ptch values, 76
were exactly 13 log rows long and 21 were 12, and the longer runs land on exact
multiples where an update went missing. Thirteen rows at 0.3 s is 3.9 seconds.
So the arithmetic was wrong by a factor of about 120, and wrong in the direction that matters. A 0.3 s log period is not undersampling flight-controller data. It is oversampling it roughly thirteen times over. Every voltage reading gets written to the CSV about thirteen times before it changes.
Method note: probe each frame with its highest-entropy sensor, Curr for the
battery frame and Ptch for attitude. RxBt is quantised to 0.1 V, so it holds its
value across several arrivals and reports a slower rate than its frame really has.
Two consequences worth carrying out of this:
- For flight-controller sensors a 1 to 2 second log period loses nothing. Only the link statistics justify 0.3 s.
- Any voltage-threshold alarm carries roughly four seconds of latency before it can even see a new number. Sag events shorter than that are invisible to EdgeTX logical switches. They exist only in blackbox.
TRSS is the tell for why the two tiers differ at all. It changed on 1384 of 1510
runs, meaning essentially every log row. It is synthesised at the transmitter module
and never waits for an air frame.
These numbers are one aircraft on one configuration, and the telemetry ratio is not even in the model file. The method transfers though, and it costs one CSV you already have.
I built a thing that reads these logs
Since the whole point of the red button is producing a CSV, I should mention that I have written a browser tool that eats exactly this file:
RX Blind-Spot Viewer, load an EdgeTX SD-Logs CSV and it renders your control link in 3D. It runs entirely in the browser: nothing is uploaded, there is no account, and the log never leaves your machine.
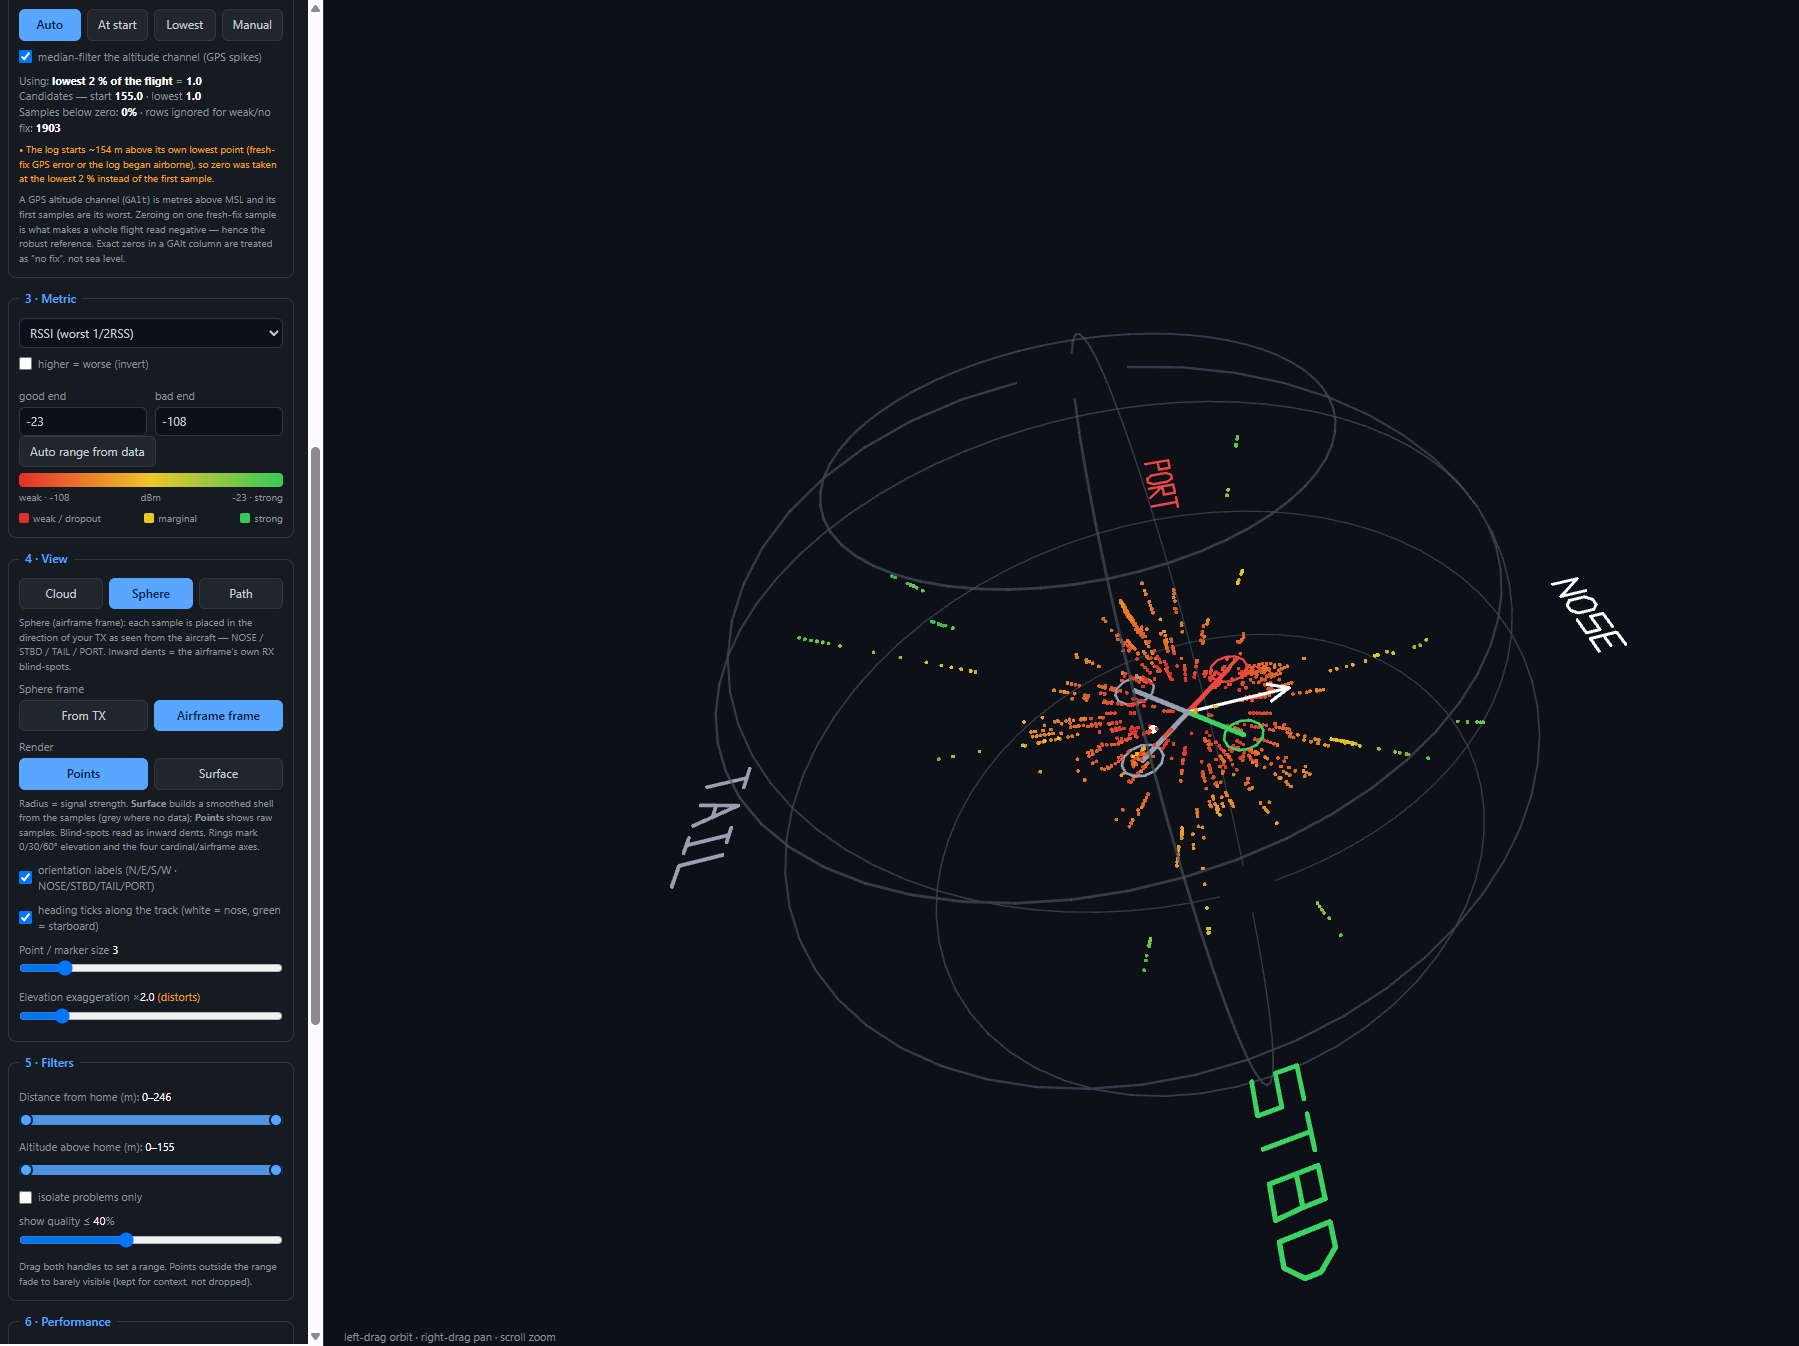
Three views:
- Cloud, true 3D flight positions, coloured by whatever link metric you pick
- Sphere, the one above, and the one I actually built the tool for. Every sample is placed in the direction of the transmitter as seen from the aircraft, so the axes are NOSE / STBD / TAIL / PORT rather than compass directions. Radius is signal strength. That makes the result an empirically measured antenna pattern for your specific airframe, and an inward dent is a real RX blind spot in a real orientation. Rings mark 0°, 30° and 60° elevation. There is a frame toggle — From TX for the spatial view, Airframe frame for the antenna-pattern view, and a render toggle: Points for raw samples, Surface for a smoothed shell that goes grey where there is no data. The white and green ticks along the track are heading markers, white for nose and green for starboard.
- Path, the trajectory, with marker size and colour inversely proportional to link quality, so bad moments are literally bigger and redder
The metric list is data-driven, it detects which sensors are actually in your log
and offers those: worst-of-1RSS/2RSS, RSNR, RQly, TRSS, TSNR, and
TPWR (treated as higher = worse, since ELRS ramps transmit power up as the link
degrades). Any raw column is selectable too. It also splits multiple flights out of
a single log file automatically.
It closes the loop on this whole post. The radio tells me about a limit in the moment, in one word, while I am flying. The viewer tells me why afterwards, with the geometry attached. Same telemetry stream, two ends of the same problem.
Two details in it are worth calling out, because they are the analysis-side solutions to problems I hit earlier in this post.
It has a robust ground reference for altitude, and that exists precisely
because of the GAlt problem from the L6 section above. GAlt is metres above
MSL, and its first samples are its worst, because the fix is fresh. Zero the
whole flight on one fresh-fix sample and the entire log reads negative. So the
viewer offers Auto / at-start / lowest / manual referencing, with an optional
median filter for GPS altitude spikes, and it treats exact zeros in a GAlt
column as "no fix" rather than as sea level. Same physics as the altitude warning
problem, attacked from the other end.
You can see that logic firing in the screenshot above, the amber note is the tool reporting that the log begins about 154 m above its own lowest point, so it took zero from the lowest 2 % of the flight instead of trusting the first sample. On a naive at-start reference, that one fresh-fix sample would have made the entire flight read as negative altitude.
It has a current-sensor correction factor, which is the calibration section
of this post, made actionable. If the FC current sensor is mis-scaled then every
mAh figure in the log is wrong by a fixed multiplier, and so is every derived
number. You set the correction to actual ÷ logged and the whole battery model
rescales with it. (In Betaflight the knob is ibata_scale, and note the direction:
lower scale means higher reported current.) On top of that it computes
return-to-home radius rings at the tightest moment of the flight, given pack
capacity, usable percentage, and a reserve you declare safe.
Which is the rigorous version of the rth callout at the top of this post. The
radio gives me a crude voltage proxy for half capacity while I am airborne, in one
word, with no maths. The viewer tells me afterwards whether that word arrived early
enough, and on which part of the flight it would not have.
One more measured detail worth flagging: the ELRS telemetry ratio is not in
the model YAML. My moduleData block contains only this:
 1moduleData:
 2   0:
 3      type: TYPE_CROSSFIRE
 4      subType: 0
 5      channelsStart: 0
 6      channelsCount: 16
 7      failsafeMode: NOT_SET
 8      mod:
 9         crsf:
10            telemetryBaudrate: 0
No ratio field, because the ratio lives on the TX module itself, configured through the ELRS Lua script. Which means sharing a model YAML does not share your telemetry ratio. If you copy my config and your logs look different to mine, that is the first place to look.
So a section that started as arithmetic ends as a measurement, which is the only direction that trade should ever go. The number I guessed was out by two orders of magnitude, in the direction that would have had me logging ten times faster than I need to.
Series: EdgeTX Cockpit Voice, part 6 of 9. Making a RadioMaster GX12 speak its own telemetry, so a low battery is something I hear instead of something I forgot to look at.
‹ Part 5: Where the Callouts Come From · Part 7: Two Antennas, Two Bands › · Start at part 1